The year 2024 was the warmest year since global records began in 1850 at 1.29°C (2.32°F) above the 20th century average of 13.9°C (57.0°F). This value is 0.10°C (0.18°F) more than the previous record set last year. The ten warmest years in the 175-year record have all occurred during the last decade (2015–2024). Of note, the year 2005, which was the first year to set a new global temperature record in the 21st century, is now the 13th-warmest year on record. The year 2010, which had surpassed 2005 at the time, now ranks as the 12th-warmest year on record.

The previous year’s record warmth was due in part to the presence of the warm phase of El Niño Southern Oscillation (ENSO), which began in June 2023 and continued until May of this year. A transition to ENSO-neutral conditions took place at that time and persisted through November before the cold phase of ENSO (La Niña) emerged in December, according to NOAA’s Climate Prediction Center. As seen in the image below, global temperatures tend to be cooler during periods of ENSO-neutral conditions and even cooler during La Niña. Although ENSO-neutral conditions were present beginning in May 2024, monthly global temperature records continued to be set or tied through August 2024.
Global monthly temperature anomalies, with ENSO status
In total there were 14 straight months of record-breaking global temperatures from June 2023 through July 2024. The July global temperature value was likely the warmest of all months on record. Monthly temperatures beginning in September and for the remainder of the year were slightly below the 2023 records. The peristence of record and near-record monthly temperatures throughout the year brought the 2024 annual temperature to its new record, continuing a warming trend that has resulted in an average rate of increase of 0.06°C (0.11°F) per decade since 1850 and more than three times that rate (0.20°C / 0.36°F) since 1975.
Global ocean temperatures in 2024 were also noteworthy, reaching 15-straight months of record-breaking temperatures, from April 2023 through June 2024. Each month from January through April each exceeded the previous monthly records by at least 0.15°C (0.27°F).
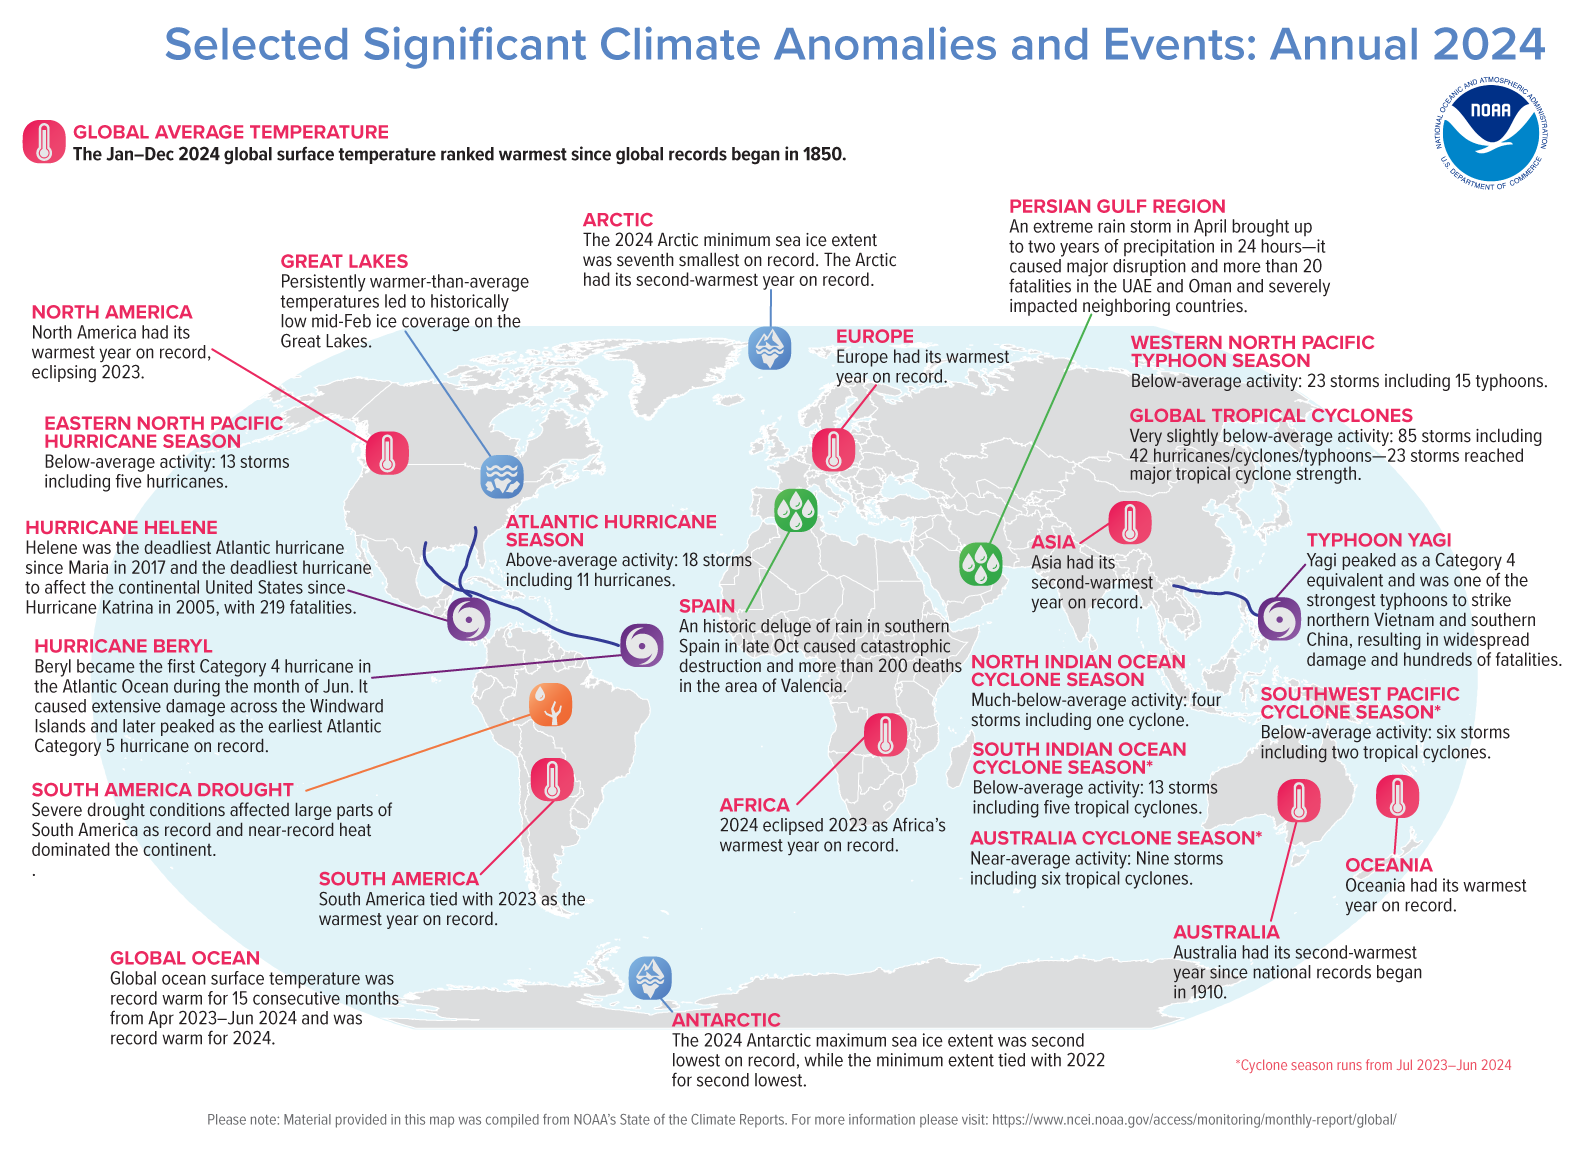
In the Arctic, 2024 was the second-warmest year on record, 2.71°C (4.88°F) above average, and 0.24°C (0.43°F) less than the record set in 2016. Arctic sea ice extent reached reached its minimum for the year in September; the seventh lowest minimum on record. Since 2007, the Arctic sea ice minimum has dropped below 5 million square kilometers (1.93 million square miles) every year, except in 2009, 2013, and 2014, when the extent barely crossed the 5 million square kilometer mark. According to the National Snow and Ice Data Center, this persistent new normal, and the related losses of most of the old and thick ice, are prominent characteristics of the new, warmer Arctic.
The 2024 Northern Hemisphere surface temperature also was warmest on record, 1.67°C (3.01°F) above average. The Northern Hemisphere winter, spring, and summer seasons were each warmest on record; 1.84°C (3.31°F), 1.61°C (2.90°F), and 1.52°C (2.74°F) above average, respectively. Meanwhile, the Southern Hemisphere summer (December–February), autumn (March–May), and winter (June–August) were each warmest on record and the year as a whole was record warmest, with a temperature that was 0.90°C (1.62°F) above the 20th century average.
| January–December | Anomaly | Rank (out of 175 years) |
Records | ||||
|---|---|---|---|---|---|---|---|
| °C | °F | Year(s) | °C | °F | |||
| Global | |||||||
| Land | +1.98 | +3.56 | Warmest | 1st | 2024 | +1.98 | +3.56 |
| Coolest | 175th | 1862 | -0.81 | -1.46 | |||
| Ocean | +0.97 | +1.75 | Warmest | 1st | 2024 | +0.97 | +1.75 |
| Coolest | 175th | 1904, 1909 | -0.43 | -0.77 | |||
| Land and Ocean | +1.29 | +2.32 | Warmest | 1st | 2024 | +1.29 | +2.32 |
| Coolest | 175th | 1904, 1917 | -0.43 | -0.77 | |||
| Northern Hemisphere | |||||||
| Land | +2.28 | +4.10 | Warmest | 1st | 2024 | +2.28 | +4.10 |
| Coolest | 175th | 1862 | -0.92 | -1.66 | |||
| Ocean | +1.20 | +2.16 | Warmest | 1st | 2024 | +1.20 | +2.16 |
| Coolest | 175th | 1904 | -0.51 | -0.92 | |||
| Land and Ocean | +1.67 | +3.01 | Warmest | 1st | 2024 | +1.67 | +3.01 |
| Coolest | 175th | 1917 | -0.56 | -1.01 | |||
| Southern Hemisphere | |||||||
| Land | +1.31 | +2.36 | Warmest | 1st | 2024 | +1.31 | +2.36 |
| Coolest | 175th | 1863 | -0.71 | -1.28 | |||
| Ocean | +0.81 | +1.46 | Warmest | 1st | 2024 | +0.81 | +1.46 |
| Coolest | 175th | 1909 | -0.41 | -0.74 | |||
| Land and Ocean | +0.90 | +1.62 | Warmest | 1st | 2024 | +0.90 | +1.62 |
| Coolest | 175th | 1904 | -0.38 | -0.68 | |||
| Antarctic | |||||||
| Land and Ocean | +0.31 | +0.56 | Warmest | 17th | 1980 | +0.62 | +1.12 |
| Coolest | 159th | 1960 | -0.59 | -1.06 | |||
| Arctic | |||||||
| Land and Ocean | +2.71 | +4.88 | Warmest | 2nd | 2016 | +2.95 | +5.31 |
| Coolest | 174th | 1902 | -1.37 | -2.47 | |||
The 1901–2000 average combined land and ocean annual temperature is 13.9°C (57.0°F), the annually averaged land temperature for the same period is 8.5°C (47.3°F), and the long-term annually averaged sea surface temperature is 16.1°C (60.9°F).
The following table lists the global combined land and ocean annually averaged temperature rank and anomaly for each of the ten warmest years on record.
| Rank 1 = Warmest Period of Record: 1850–2024 |
Year | Anomaly °C | Anomaly °F |
|---|---|---|---|
| 1 | 2024 | 1.29 | 2.32 |
| 2 | 2023 | 1.19 | 2.14 |
| 3 | 2016 | 1.03 | 1.85 |
| 4 | 2020 | 1.02 | 1.84 |
| 5 | 2019 | 0.98 | 1.76 |
| 6 | 2017 | 0.94 | 1.69 |
| 7 | 2015 | 0.91 | 1.64 |
| 8 | 2022 | 0.90 | 1.62 |
| 9 (tied) | 2018 | 0.87 | 1.57 |
| 9 (tied) | 2021 | 0.87 | 1.57 |
The year was characterized by record and near-record warm temperatures across much of the globe. Record-high annual temperatures covered much of the northern half of South America stretching through Central America and Mexico into the south-central U.S., large parts of central and northern Africa, central and eastern Europe, southern Asia, and large areas of the western Arctic, southeastern Canada and the northeastern U.S. In Antarctica warmer to much-warmer-than-average temperatures covered much of the western half of the continent. There were few land areas with near-average to below-average temperatures; these included parts of eastern Antarctica, the southern tip of South America, the southern half of Greenland, and small parts of the Russian Far East.
Sea surface temperatures for 2024 were record warm across much of the central and northern Atlantic Ocean, most of the northern half of the Indian Ocean, and parts of the western Pacific Ocean and Southern Ocean. Sea surface temperatures were near to below average in parts of the western North Atlantic, the southwestern Atlantic, the southeastern Pacific, the southwestern Indian Ocean, parts of the Southern Ocean including the Drake Passage, as well as the Bering Sea, the Gulf of Alaska, and the Sea of Okhotsk.
January-December 2024 Blended Land and Sea Surface Temperature Anomalies in degrees Celsius
January-December 2024 Blended Land and Sea Surface Temperature Percentiles
North America’s annual temperature was 2.22°C (4.00°F) above the 1910-2000 average, its warmest year on record. Temperatures were unusually warm throughout the year. Two seasons were record warm; winter (December–February) and autumn (September–November), while spring and summer were both the third-warmest such seasons on record. The months of February, September, and October (tie) were warmest on record. February and December were the most anomalously warm months of the year, 3.29°C (5.92°F) and 3.32°C (5.98°F), respectively above the 1991–2020 averages. North America’s yearly temperature has increased at an average rate of 0.15°C (0.27°F) per decade since 1910, while the average rate of increase over the past 50 years (since 1975) is more than double the century-scale rate (0.33°C/0.59°F).
South America’s annual temperature was 1.78°C (3.20°F) above average — tying 2023 as the warmest year on record. This was South America’s 48th consecutive year with temperatures above average, and the continent’s nine warmest years have occurred since 2014. South America’s annual temperature has increased at an average rate of 0.15°C (0.27°F) per decade since 1910, and the average rate of increase is nearly double (0.26°C/0.47°F) that trend since 1975.
Two seasons were record warm (December–February, March–May) while June–August and September–November were third- and second-warmest on record, respectively. South America had monthly temperatures that were above-average to record warm every month during 2024. Six months (January–April, June, September) were record warm while two (October, November) were second warmest. In three of the record-warm months (March, April, June), the 2024 temperature exceeded the previous record by 0.44°C (0.79°F) to 0.46°C (0.83°F). The month of September had the highest temperature departure of the year at 2.55°C (4.59°F); while May had the smallest temperature departure at 0.91°C (1.64°F).
Europe had its warmest year on record in 2024, 2.45°C (4.41°F) above average. Spring (March–May) and Summer (June–August) were record warm while winter (December–February) was second warmest and autumn (September–November) was third-warmest on record. Three months were record warm (February, July, August) while March, April, May, June and September were second warmest. February had the highest monthly temperature departure, 4.12°C (7.42°F) above average. The smallest monthly temperature departure for the year was 1.49°C (2.68°F) in November.
This was the 28th consecutive year with temperatures above the 1910–2000 average for Europe, and the nine warmest years on record have occurred since 2014. The annual temperature for Europe has increased at an average rate of 0.16°C (0.29°F) per decade since 1910; however, it has nearly tripled to 0.45°C (0.81°F) since 1975.
Africa had an annual temperature of 1.65°C (2.97°F) above average, which is the warmest on record, eclipsing the previous record set last year. This was Africa’s 48th consecutive year with temperatures above average, and Africa’s 10 warmest years have occurred since 2010. Africa’s annual temperature has increased at an average rate of 0.13°C (0.23°F) per decade since 1910, and it has more than doubled to 0.28°C (0.50°F) since 1975.
Every month of 2024 was more than 1.0°C (1.8°F) above average. May had the highest departure, 2.20°C (3.96°F) while November had the smallest (1.12°C /2.02°F). Three months were record warm (March, May, June) and three (January, February, July) were second warmest. No month was cooler than ninth warmest on record (December).
Asia had its second-warmest year on record, 2.17°C (3.91°F) above average. The year 2024 marked the 37th consecutive year with temperatures above the 1910–2000 average. Asia’s ten warmest years have occurred since 2007. Asia’s trend during the 1910–2024 period was 0.18°C (0.32°F) per decade; however, the 1975–2024 trend is more than twice the longer-term trend (0.40°C/0.72°F).
Every month of 2024 was more than 1.5°C (2.7°F) above the 1991–2020 average. November had the largest monthly anomaly, 3.43°C (6.17°F), above average. April, June, July, and November 2024 were the warmest such months on record. Summer (June–August) was record warm, 1.89°C (3.40°F) above average, while autumn (September–November) was second-warmest on record, 2.30°C (4.14°F) above average, and 0.25°C (0.45°F) cooler than 2023.
Oceania had its warmest year on record, 1.42°C (2.56°F) above the 1991–2020 average. Eight of Oceania’s ten warmest years have occurred since 2013. The 1910–2024 trend for Oceania is 0.12°C (0.22°F) per decade and the trend during the 1975–2024 period is 0.19°C (0.34°F) per decade.
Oceania had only one month that was record warm (August), but the last two seasons of the year were both record warm. Winter (June–August) was 1.45°C (2.61°F) above average, 0.16°C (0.29°F) warmer than the previous record warm winter of 2023, while spring (September–November) was 1.76°C (3.17°F) above average, and 0.24°C (0.43°F) above 2020. The month with the largest temperature departure for the year was August (2.30°C/4.14°F), while April had the smallest temperature departure at 0.41°C (0.74°F) above average. It was the 41st warmest April on record.According to Australia’s Bureau of Meteorology, Australia had its third-warmest summer (December–February), second-warmest winter (June–August) and its warmest spring (September–November) on record, while the year 2024 was its second warmest since national records began in 1910.
Antarctica’s annual temperature was 0.31°C (0.56°F) above average, the 17th-warmest year on record. Seasonal and month-to-month swings in temperatures were evident. Summer (December–February) was the 10th coolest on record while winter (June–August) was third warmest. Seven months were warmer than average while five were cooler than average. July was the fifth-warmest such month on record for the Antarctic, 1.16°C (2.09°F) above average, while August was second warmest, 1.81°C (3.26°F) above average. October was ninth warmest. No other month was within the top-ten warmest. Among the cooler-than-average months, January was the ninth-coolest such month on record, -0.52°C (-0.94°F) below average, while February was -0.23°C (-0.41°F), April -0.30°C (-0.54°F), November -0.18°C (-0.32°F), and December -0.01°C (-0.02°F) below average. The 1910–2024 trend for Antarctica was 0.04°C (0.07°F) per decade and the trend during the 1975–2024 period is half as large, 0.02°C (0.04°F) per decade.
Precipitation data from the Global Historical Climatology Network (GHCN) shown in the maps below are augmented by data with greater spatial coverage from the Global Precipitation Climatology Project (GPCP). The GHCN and GPCP map of 2024 precipitation anomalies show areas that were unusually wet for the year contrasted in other areas by drier-than-normal conditions.
Below-average annual precipitation occurred in areas that included much of Canada extending into parts of the western U.S. and Mexico. The most expansive and severely drier-than-average conditions occurred across much of South America, most notably in large parts of Brazil and neighboring Bolivia and Peru where in many locations the driest to near-driest year on record occurred. Other drier-than-average areas included southern and southwestern Africa, where record to near-record dryness occurred across much of Zimbabwe and Zambia as well as parts of Cameroon, the Republic of the Congo, and Gabon. The combination of record and near-record temperatures along with the lack of precipitation led to severe drought in many areas. Parts of eastern Ukraine and neighboring Russia also were notably drier-than-average in 2024.
In contrast, anomalously high precipitation fell in areas that included a large part of the African Sahel, where record and near-record wet conditions were widespread. Central Asia including much of Kazahkstan and central Russia had widespread much-above-average to record-wet conditions, as well as eastern Mongolia and northeast China. Parts of these areas were hit by periods of heavy rain and flooding as noted in the continent summaries below. A number of other areas with above-average precipitation in 2024 had flooding and other impacts associated with tropical systems. These included the Deep South and southeastern U.S., which were severely affected by Hurricanes Beryl, Debby, Francine, Helene, and Milton. Other areas widely affected by tropical cyclones included Tanzania, Kenya, Bangladesh, India, Vietnam, the Philippines, Japan, eastern China, Indonesia, Malaysia, and parts of northern Australia.
January-December 2024 Land-Only Precipitation Anomalies
January-December 2024 Land-Only Precipitation Percent of Normal
Snow cover data are provided by the Rutgers University Global Snow Laboratory. The period of record is from 1967–2024 for a total of 58 years. The sea ice extent data are provided by the National Snow and Ice Data Center (NSIDC) and are measured from passive microwave instruments onboard NOAA Satellites. The sea ice extent period of record is from 1979–2024 for a total of 46 years.
Northern Hemisphere snow cover extent averaged 9.2 million square miles in 2024, which was slightly below average. Monthly extent ranged from 18.1 million square miles in January to just under 1.0 million square miles in August, both of which were slightly below average.
Arctic sea ice extent averaged 4.03 million square miles in 2024, the seventh lowest on record. The maximum extent in March was 5.74 million square miles, which ranked 15th lowest, while the monthly minimum extent in September was 1.69 million square miles, which ranked sixth lowest. The minimum for the year was reached in mid-September and was the seventh lowest on record.
Antarctic sea ice extent averaged 4.00 million square miles in 2024, the second lowest on record. The maximum extent in September was 6.59 million square miles, which ranked second lowest, and the minimum extent in February was 830,000 square miles, which also ranked second lowest. According to the NSIDC, Antarctic sea ice reached its minimum extent for the year, at 1.99 million square kilometers (768,000 square miles) on February 20, 2024. This tied with 2022 for second lowest on record, behind 2023. It was the third consecutive annual minimum below 2 million square kilometers (772,000 square miles).
Ocean Heat Content (OHC) is essential for understanding and modeling global climate since > 90% of excess heat in the Earth’s system is absorbed by the ocean. Further, expansion due to increased ocean heat contributes to sea level rise. Change in OHC is calculated from the difference of observed temperature profiles from the long-term mean.
| Basin | 0-700 meters | Rank (1955-2024) | |||||
|---|---|---|---|---|---|---|
| Entire Basin | Northern Hemisphere | Southern Hemisphere | ||||
| Atlantic | 9.232 | 1st | 5.355 | 1st | 3.877 | 1st |
| Indian | 5.072 | 1st | 0.729 | 5th | 4.343 | 1st |
| Pacific | 7.166 | 3rd | 4.091 | 1st | 3.075 | 8th |
| World | 21.469 | 1st | 10.174 | 1st | 11.295 | 2nd |
| Source: Basin time series of heat content | ||||||


The annual global ocean heat content (OHC) for 2024 in the upper 700 meters and upper 2000 meters was record high, surpassing the previous records set in 2023. The five highest 2000 meter OHC have all occurred in the past five years while the five highest 700 meter OHC have all occurred since 2019. The regions of the Atlantic and Indian Ocean had their highest OHC in the upper 700 meters since the 1950s, while the Pacific had its third highest.
Additional information on OHC and access to all data is provided here. Also, information on the 2023 OHC is available in the paper titled Another Year of Record Heat for the Oceans (Cheng et al., 2023).
NOAA National Centers for Environmental Information, Monthly Global Climate Report for Annual 2024, published online January 2025, retrieved on January 14, 2025 from https://www.ncei.noaa.gov/
https://www.ncei.noaa.gov/access/metadata/landing-page/bin/iso?id=gov.noaa.ncdc:C00672